Sales channel analytics
Tracking sales sources — social media, websites, email newsletters, and external partners.
 evenda.
Available Language Versions
РусскийEnglishSrpskiDeutschTürkçeქართულიEspañolहिन्दीবাংলাPortuguêsTiếng ViệtFrançaisItaliano한국어العربيةBahasa Indonesia日本語中文አማርኛ (Amarəñña)অসমীয়া (Ôxômiya)Azərbaycan diliБългарски (Bǎlgarski)ČeštinaΕλληνικά (Elliniká)Eesti keelفارسی (Fārsī)Fulfuldeગુજરાતી (Gujarātī)HausaMagyarIgboBasa Jawaಕನ್ನಡ (Kannaḍa)Latviešu valodaMalagasyBahasa Melayuമലയാളം (Malayāḷam)मराठी (Marāṭhī)မြန်မာဘာသာ (Myanma Bhasa)नेपाली (Nepālī)NederlandsAfaan Oromooଓଡ଼ିଆ (Oṛiā)پښتو (Paṣ̌to)PolskiRomânăسنڌي (Sindhī)සිංහල (Siṁhala)SlovenčinaChiShonaBasa Sundaதமிழ் (Tamiḻ)Wikang Tagalogతెలుగు (Telugu)ภาษาไทย (Phasa Thai)اردو (Urdū)Oʻzbek tiliYorùbáVahcuenghHrvatskiDanishFinnishSwedishFeatures
Monitor all key metrics of your events in real-time. Our analytics allow you to assess sales, venue occupancy, participant activity, and the effectiveness of advertising campaigns without unnecessary manual work.
0% is Evenda's commission on ticket sales. Subscription charges and your payment provider's fees are separate.
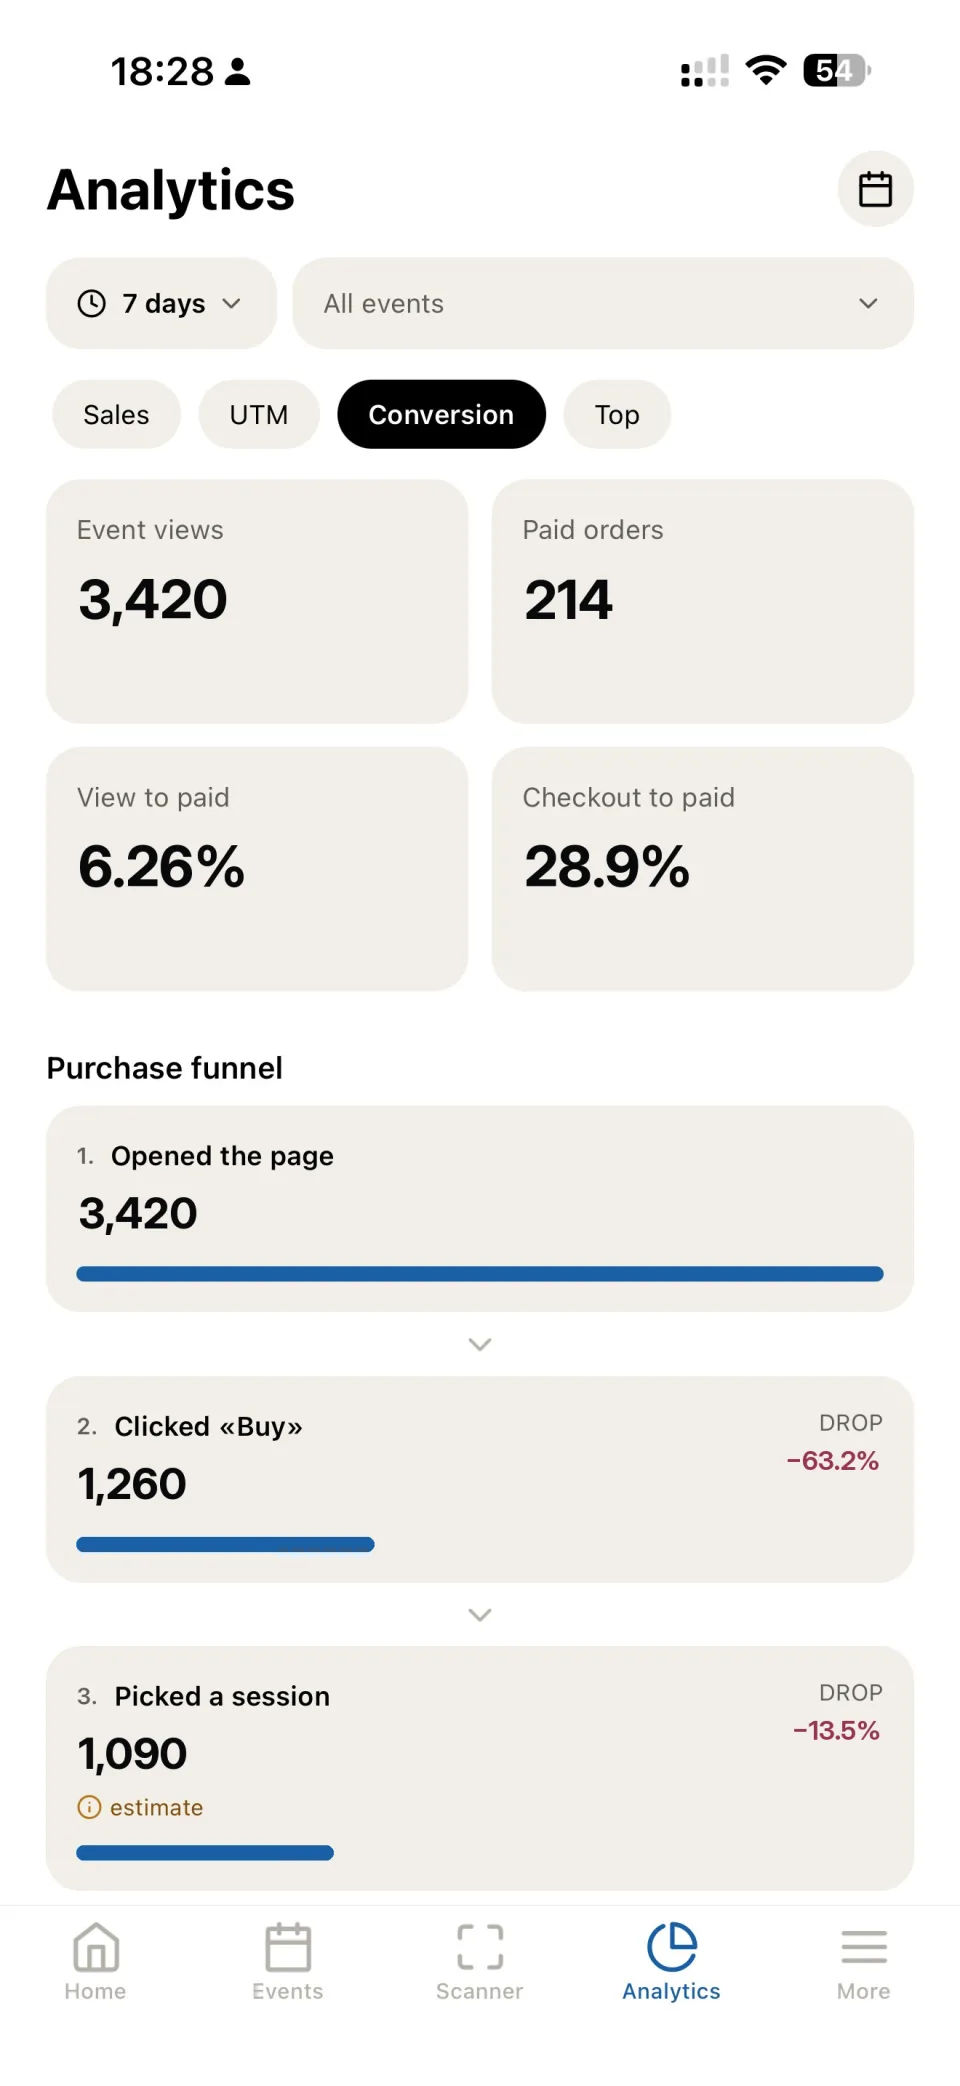
Tracking sales sources — social media, websites, email newsletters, and external partners.
Charts and tables with filtering options by time, events, and ticket categories.
Ready-made reports on sales, attendance, and advertising campaign effectiveness, available for download.
Compare the effectiveness of different events and identify the best formats and venues.
Key metrics:
Event analytics collects data on all aspects of your event so you can make informed decisions to increase revenue and improve organization.
Yes, reports are available in PDF and Excel formats for convenient analysis.
Yes, the system allows you to create reports for specific events, categories, rates, and sales sources.
Yes, you can track the effectiveness of campaigns on social media, email, and external sources.
Yes, the system shows current data on participant entry and venue occupancy during the event.
Yes, the platform allows you to create comparative reports to identify the most successful formats and venues.
No. All analytics is available in a user-friendly interface with visual graphs and filters.
Yes, an API is available for data transfer to third-party accounting and marketing systems.
Get started
Start in your browser. No installation needed.